


|
||||
|
|
|||
|
||||
|
|
|||
|
Search
Log in
|
Aktakom DSO-Reader Light Software for Oscilloscopes
FeaturesRead data is displayed on oscillogram graphs, spectrograph, there is ability for signal digital filtering, cursor and automatic measurements, file recording and data reading. Data saving is in AUL format. There is an ability to export to external applications (Excel, Mathlab etc.). Images are saved in bit-mapped (.bmp) and vector formats (.wmf , .emf). Vector format can be easily scaled. Program user interface consists of workspaces (windows). Every workspace contains controls set (Controls) which allows user to influence the program operation as well as indicators which display the necessary information. Comparing to Controls user can not influence the indicators directly. The majority of these controls are the part of Windows standard interface and do not require any special usage explanations. Program settings: background color, net, oscillogram, cursors, trigger marks, saving/loading of color schemes into file, adjustment of the oscillogram thickness etc. Signal processing provides the following:Program decimation:
Filtration:
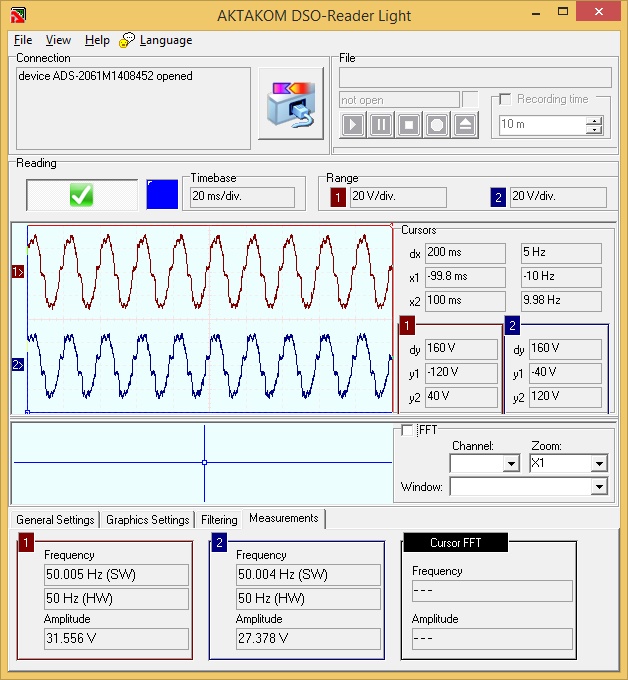
Displaying in the following modes: points, lines, spline. Main windowThe general view is shown in the below picture.
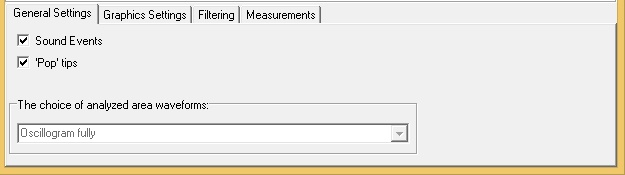
Description of Controls and indicatorsConnection – button used to connect to the device and text field for results messages. If you run the program with the device switched on and connected to the PC already the connection should be automatic. Read – group of elements used to display data read from the device – button to start/stop reading, parameters of sweeping and the channels ranges, oscillograms graph and cursor measurement panel. Below there is a group of FFT - Fast Fourier Transform - elements used for spectrum analysis of signals. Cursor measurement of the spectrum graphs is shown below, in “Measurements” tab, in “FFT cursor” group. Prompt message: Double click the spectrum graph to measure the main harmonic of the signal. General settings tab:
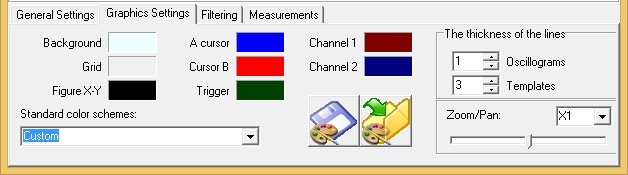
Events sound recording – allows using the program sound messages (the computer should be equipped with audio system). It doesn’t affect the sound use for Windows standard messages. Pop-up tips – allows using pop-up signatures of the elements of the program user interface. If you are good at the program operation processes we recommend to switch this option off to speed up the program work and eliminate the visible noises. Graphics settings tab:
It allows user to set the needed colors of different graphs elements. Left-clicking allows you to choose the color, right-clicking sets the color on default. Drop-down list below allows selecting some of the standard color schemes. Buttons to the right of the list allows saving into files and loading from files user color schemes. Line thickness – sets the thickness of oscillograms lines in pixels in the main window. On default the graphs lines has thickness of 1 pixel for maximum clear waveform image. However at high resolution printing or when viewing these oscillograms on a big screen (e.g. when using a projector) very thin lines can turn to be hardly viewed. By using this parameter you may solve this problem. Note: increasing of this parameter may course retardation of graph redrawing, therefore use it with proper care. Filtration tab:
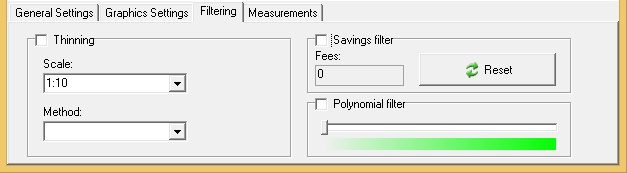
Decimation group controls decimation functions of the received oscillograms. Scale sets the quantity of decimation points (e.g. 1:10 means leaving in the oscillogram 1 point from every 10). Method describes the decimation way: “Sampling” – there is only 1 point selected on the area without amplitude correction. “Average” – there is arithmetical mean taken from the amplitude of the area sampling. “Median” – the area is displayed as a median point. “Peak” – the minimum and maximum values of the area amplitude are taken alternately. Accumulative filter averages the oscillogram points with the appropriate points of the oscillograms which were received before. Fee field displays the number of averaged oscillograms. Reset button restarts the averaging process from the beginning. Polynomial filter doesn’t require any preliminary settings, it averages every sample according to the adjacent ones, the regulator specifies the filtration value, from the zero leftmost up to the rightmost position. Measurements tab:
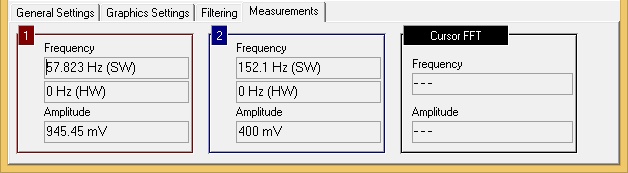
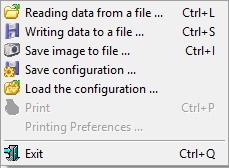
Displays automatically measured frequency and amplitude for two channels and cursor of the specrum analysis graph. Main menuFile Menu
Reading data from a file… - used to select the file to read the previously recorded data.
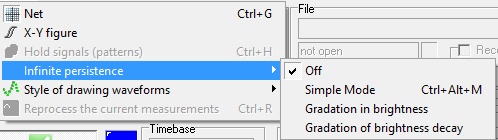
View menu
Net – used to open/close the net on the oscillogram graph.
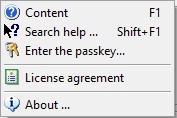
Help menu
Contains commands to call the current help file and the window of the program brief information. Standard packageThe software in the standard package of the device has no physical media (CD) and can be downloaded at www.tmatlantic.com after the purchasing and registering the equipment with a serial number. This software is paid-for and its cost is included into device value. In the new version of the software, when connecting the unit for the first time, it will ask for a license (access key). It is available online after product registration. Insert the entire character set by coping and pasting it from www.tmatlantic.com. Follow the instructions on the site. We recommend that you make and keep a copy of the downloaded software. Follow the our websites news releases to receive software updates. Frequently Asked Questions
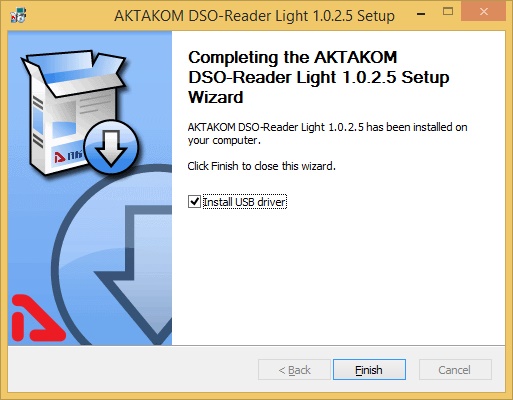
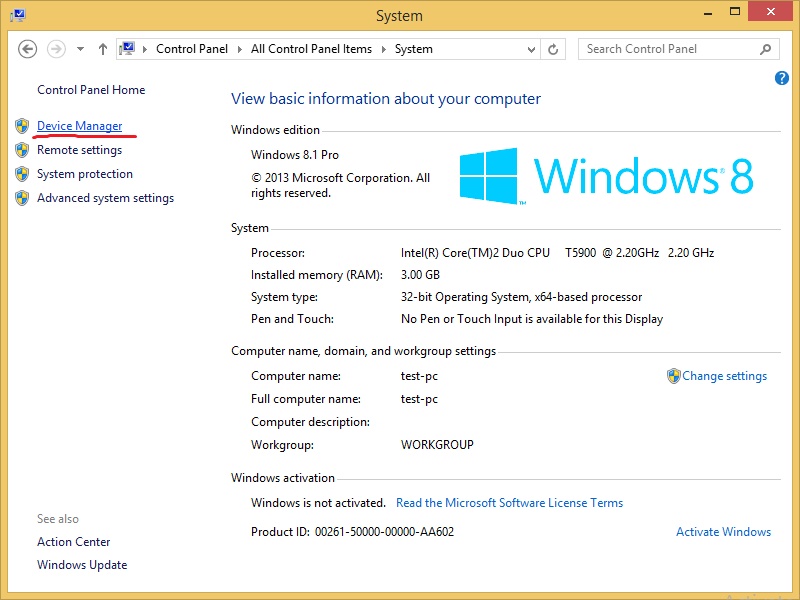
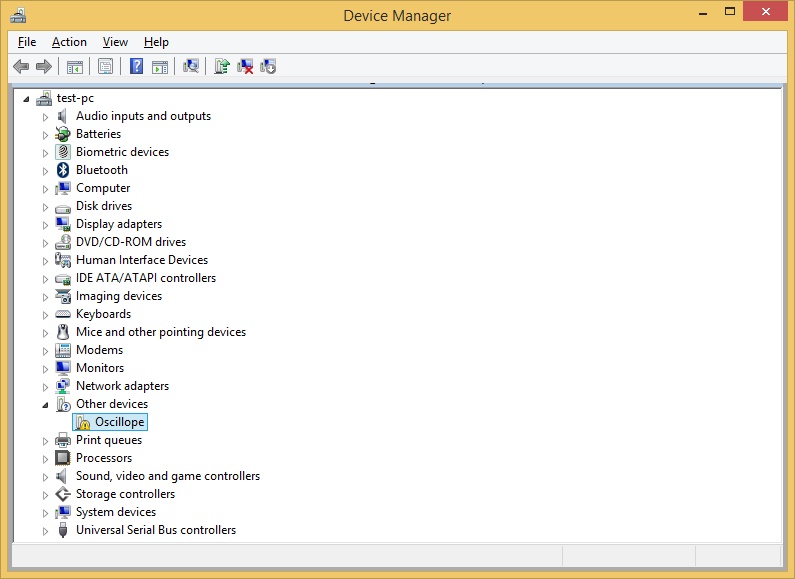
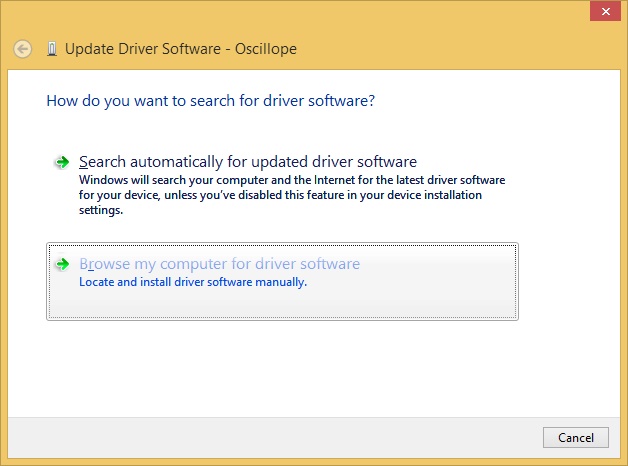
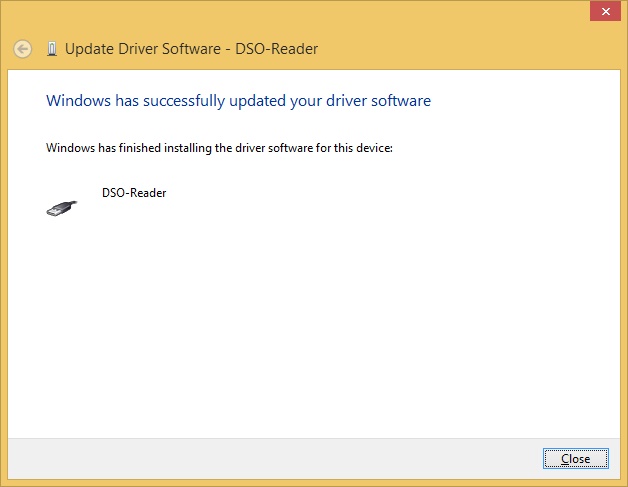
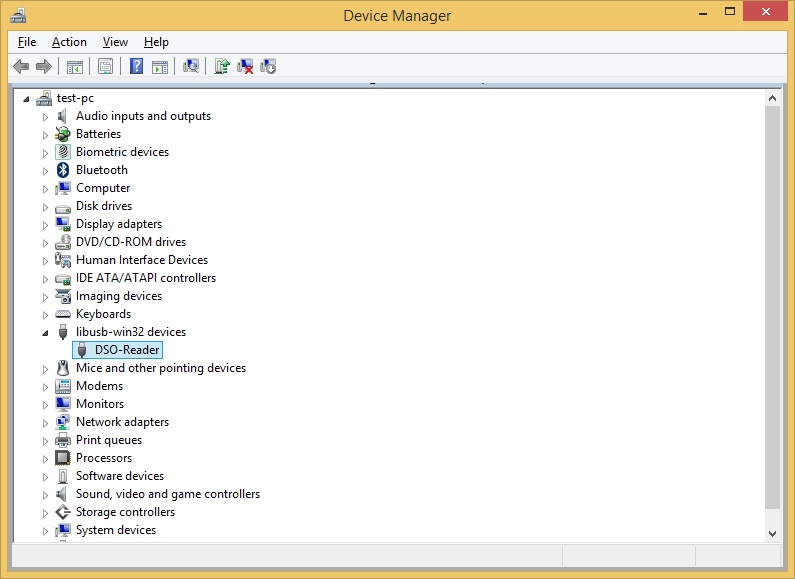
AKTAKOM DSO-Reader Light software demoAKTAKOM DSO-Reader Light Software InstallationALL RIGHTS RESERVED. AKTAKOM software is protected under International and Federal Copyright Laws and Treaties. Any unauthorized copy, reprint or use of this material is prohibited. No part of this software may be reproduced or transmitted in any form or by any means, electronic or mechanical, including photocopying, recording, or by any information storage and retrieval system without express written permission from the author / publisher. Windows, Windows logo are either registered trademarks or trademarks of Microsoft Corporation in the United States and/or other countries. Back to the section |