


|
||||
|
|
|||
|
||||
|
|
|||
|
Search
Log in
|
Aktakom Data Logger Monitor (ADLM-W)AssignmentADLM-w software is designed for data reading from devices of AKTAKOM ATT, ATE series, for measurement data acquisition, its processing, displaying and storage in a PC with Windows XP x32, Windows 7 x64, Windows 7x32, Windows 8 x64, Windows Vista OS. CapabilitiesThe application provides the detection and listing of devices available for operation, connected to the computer locally (via USB interface), initialization and testing of the selected device sample. There are 2 modes implemented: single-channel and multi-channel (see below). The application provides a continuous data reading method (recorder mode). The collected readings are displayed on the graphs that can be zoomed by user at will, graphs drawing style is adjustable (with points, cuts, splines). For graph manual measurements there are two cursors and ten user labels available, positions and intervals for cursors and labels are displayed numerically in a separate program window. The application allows you to record measurement data into files as numerical data or as a graph image. Files with numerical data can be reloaded into the application for viewing and analysis. Measurement data printing is also supported, it can be sent to a printer or printed into a graph file. The program requires the use of USB-RS232 (TTL) interface converter ACE-1025 or USB-RS232 interface converter ACE-1026 depending on the type of the compatible device (to check the compatibility visit the web page of the appropriate interface converter ACE-1025 and ACE-1026)
Interface and operation orderSingle-channel mode. Recorder, alarm signaling, statistics, table
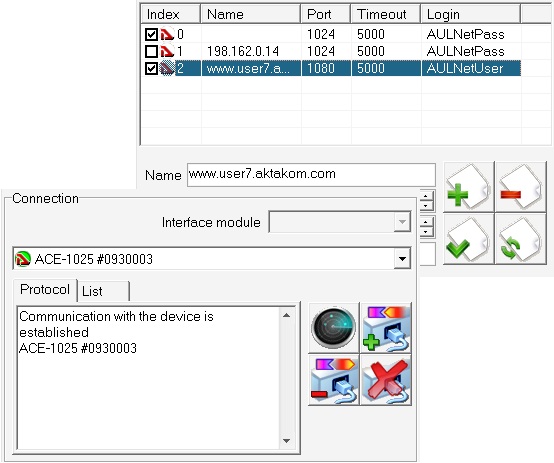
Device connection to the program looks the standard way for multi-channel AKTAKOM applications: keys to search a device, keys to switch ON/OFF a device, list of the detected available devices. The list contains locally connected devices (via USB-cable to the PC with the program launched) as well as the devices detected in the network (search is made following the addresses in the socket list).
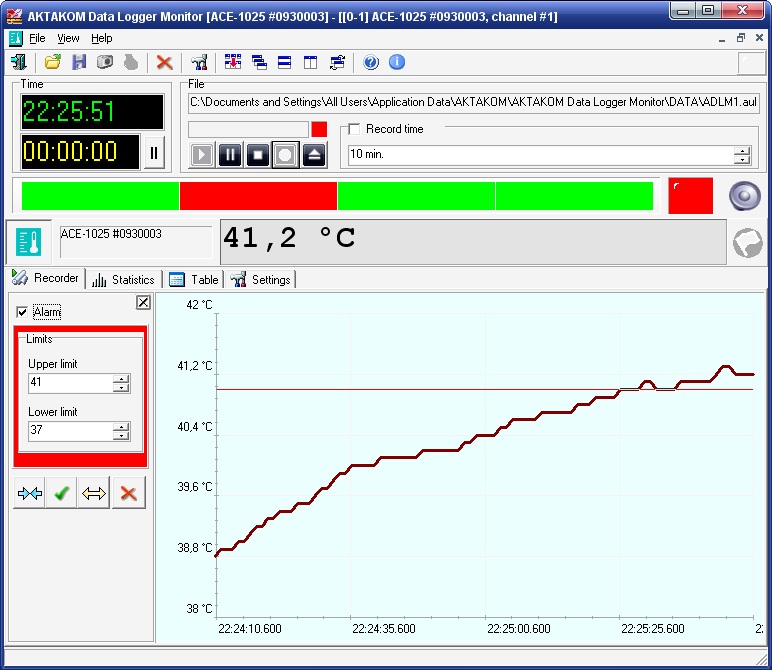
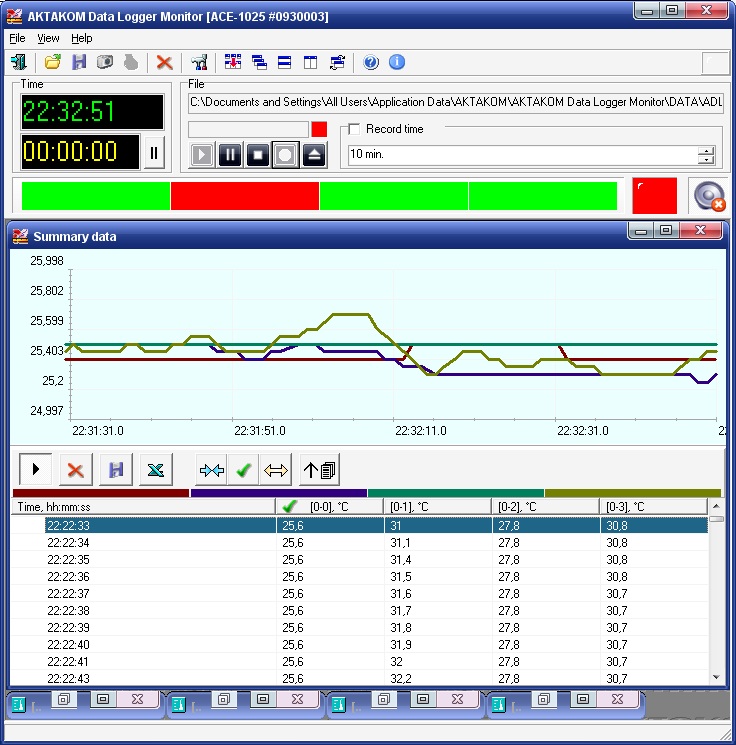
The top of the channel window displays the current numerical value of the channel measurements, below – three tabs: Recorder, Statistics, Table. The first tab which is Recorder allows you to inspect the changing graph of the value under measurement in time. Here cursor measurements are available as well as alarm signaling which allows you to track automatically the parameter under measurement overrunning the set limits. Besides colour and sound signaling the program is capable of sending system messages with a code of alarm signaling. This allows connecting random external applications for the required event response. Recorder measurement data can be saved into CD file for further viewing or exporting to process it in other applications. Herewith there is a good capability to set the recording time. For example when starting the measurement record of some long-term process you may set the file recording time as 10 minutes. In this case the program will record the next 10 minutes of measurements, afterwards the recording process will be automatically stopped, and it will be unnecessary for the operator to monitor the record on his own. The second tab – Statistics – makes it possible to determine the main parameters of the statistical analysis of measurements: minimum and maximum values, average, deviation, skewness and kurtosis. Assignment of measurements is also presented in graphic form clearly indicating the nature of the measurement error on the histogram. The third tab – Table – displays the measurement results in a simple table of numerical data. On a large scale, it's just an alternative way of representing the recorder data, and it is usually used for more details on the graph part of interest. It is worth mentioning one more interesting program feature. As measurement result it allows using direct value measured by the device as well as derived value calculated by user entering random mathematical formula. In the simplest case, this option allows you to replace one measurement units by other ones, e.g. calculate the flow speed not in m/s but km/h. And it may provide hardly defined derived measurements which depend on several parameters, e.g. in accordance with the measurement of temperature, pressure and humidity you may get result measurements of the air density. It is obvious that in this case it is necessary to connect additional measurement channels beforehand. Multi-channel mode. Multi-window interface
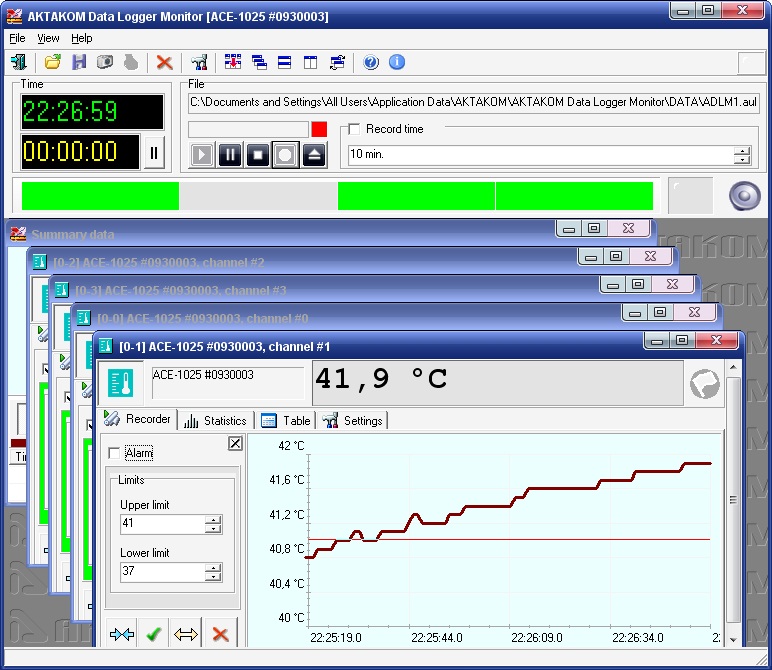
The application allows you to connect several devices simultaneously and take measurements from several channels respectively. Data types measured on different channels can coincide or vary. In theory general number of connections is not limited, but practically the use of endless channels list is not possible due to limited PC resources. MDI technology allows you to put in order the channel windows location in the application working space and organize the most convenient measurement results view.
Complex mode. Summary graph and tablePresentation way of each channel in a separate window has advantages as well as disadvantages. On the one hand it’s convenient to see several individually set windows with measurements at once with its own statistics for each channel. But sometimes there is need to correlate measurements with one another. First method: open a recorder tab for the needed channel and tile these windows horizontally.
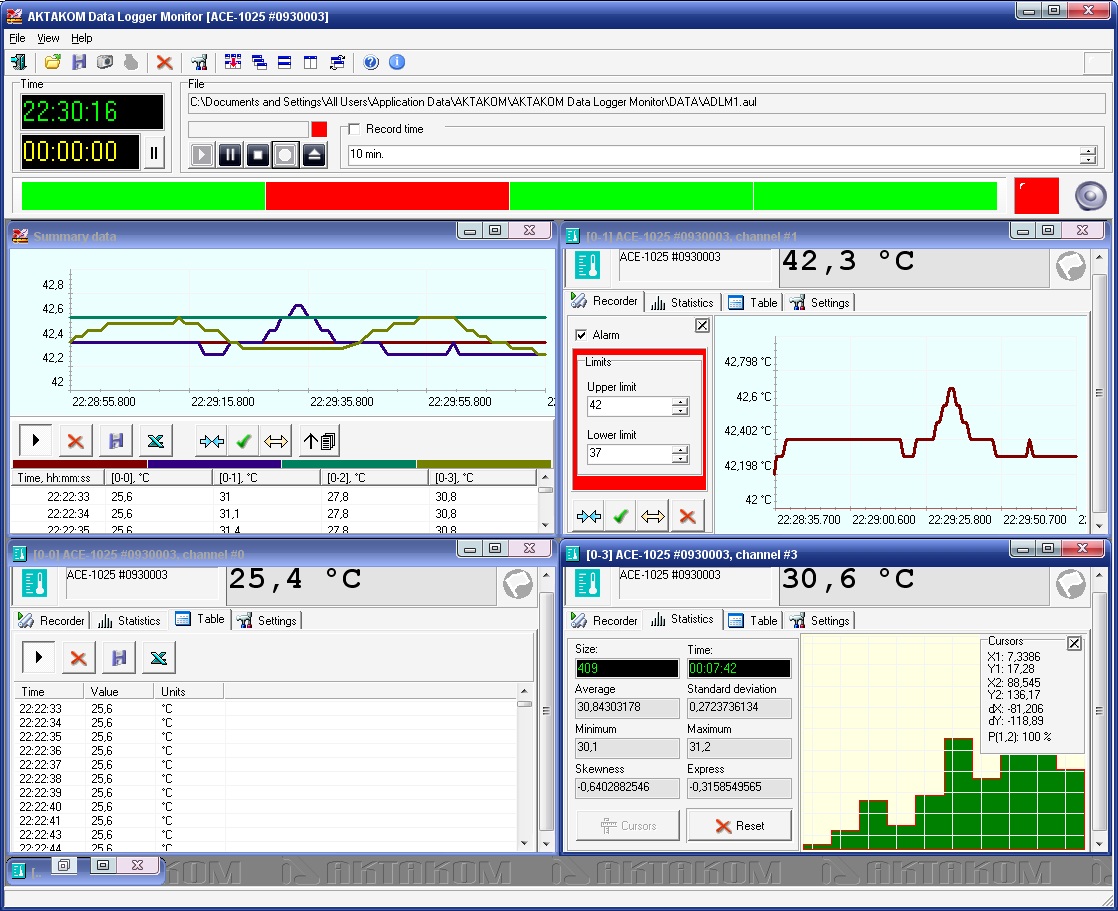
Second method: besides child windows of the channel measurements the application is capable of creating one summary data window for all channels. Top part of this window contains a graph with the measurement cyclograms of all channels plotted in single time-scale. Since scales and measurement types on different channels can be absolutely different each cyclogram is constructed on its own vertical scale. But if the graph depicts a dozen of scales for a dozen of channels they will take all space on the screen and there will be no space for curves themselves. Developers have solved this problem by displaying only one vertical scale but making it changeable: by selecting the needed column from the data table at the lower part of the window user simultaneously selects the needed graph scale. This software in its standard representation doesn’t have any data medium. It can be downloaded from www.tmatlantic.com after your device registration by entering its serial number. You may download the software files after the invoice payment (you will receive the code for download). It’s recommended to make a timely backup copy of the received files. The loss of the software or the download code will cause extra payment. This software can be recorded to a CD. CD recording and its delivery will also cost some extra payment. Frequently Asked Questions
AKTAKOM Data Logger MonitorALL RIGHTS RESERVED. AKTAKOM software is protected under International and Federal Copyright Laws and Treaties. Any unauthorized copy, reprint or use of this material is prohibited. No part of this software may be reproduced or transmitted in any form or by any means, electronic or mechanical, including photocopying, recording, or by any information storage and retrieval system without express written permission from the author / publisher. Windows, Windows logo are either registered trademarks or trademarks of Microsoft Corporation in the United States and/or other countries. Back to the section |
")